


The bitcoin price has surged up to 4.85 percent this Tuesday, but there is still a strong case of an imminent pullback.
According to Crypto Michaël, an Amsterdam-based cryptocurrency analyst, bitcoin lacked adequate follow-up volume that could sustain the ongoing upside price action. The bearish interpretation followed the textbook volume-price relationship, in which a price move up on a declining trading activity signals a selling sentiment.
Michaël said if the bitcoin price hangs near its newly established higher high for far too long, it could result in a pullback scenario, as shown below.
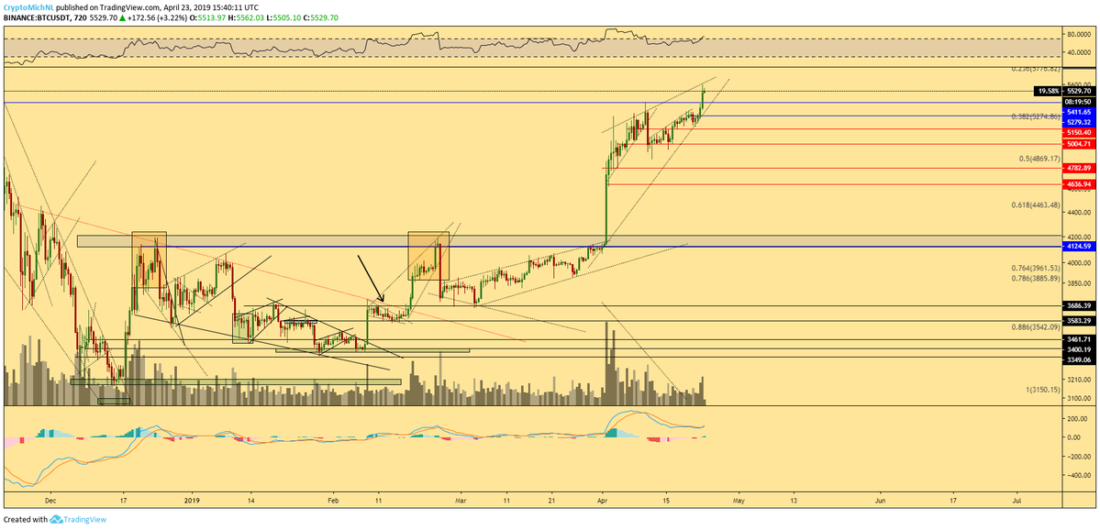
Bitcoin Price Inside a Rising Wedge | Source: Crypto Michaël
Michaël showcased the bitcoin price trending inside a rising wedge pattern. Technically, it is a bearish pattern that begins wide at the bottom but starts contracting as the asset price moves upward. As the trading range narrows, the volume also starts declining. And, at the apex, the asset price breaks to the downside accompanied by a sudden surge in volumes. Michaël highlighted similar rising wedge formations via bitcoin’s recent price behaviors (boxes).
“The longer we keep on hanging here, the more meh it’s going to be,” the analyst stated. “I [really] want to see follow up volume. However, we’re making some [bear divergences] on higher timeframes already + hanging in resistance + altcoins bleeding hard. I’m remaining very cautious.”
Bull Trap
Michaël also envisioned a bull trap scenario, in which the bitcoin price breaks above the rising wedge pattern, but may soon reverse direction. A potential bearish divergence indicator somewhat supported the bearish scenario. Technically, the bitcoin’s daily Relative Strength Index was moving downwards while its price was trending upward. Such a pattern typically ends up in a downward action for the asset.
Nevertheless, Michaël clarified that there were crucial resistance areas that could invalidate the entire bearish theory, as shown in the chart below.
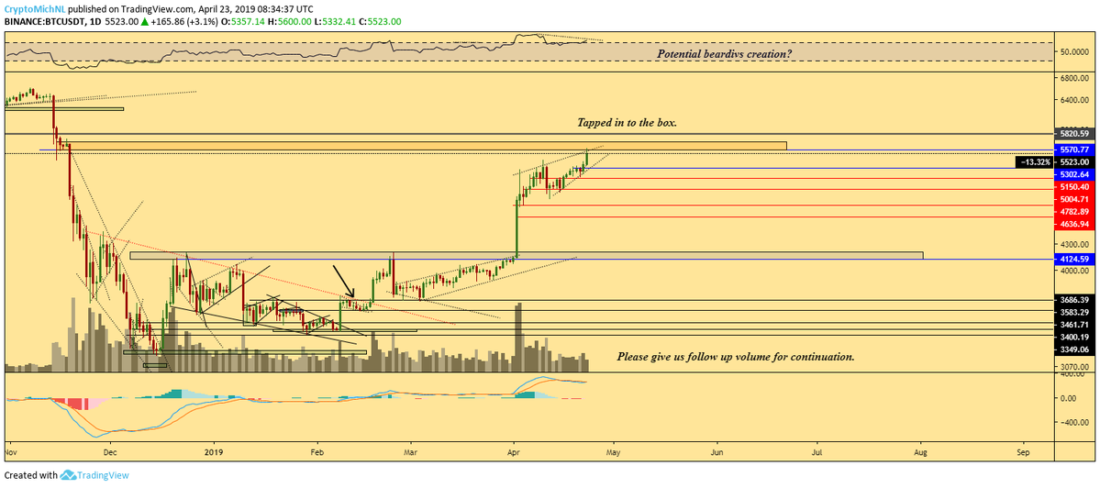
Bitcoin Bull Trap | Source: Crypto Michaël
“I’m still neutral and not much changed overall,” he stated. “Pushing through orange block = [very good] sign.”
Double Bottom – Long Term Bull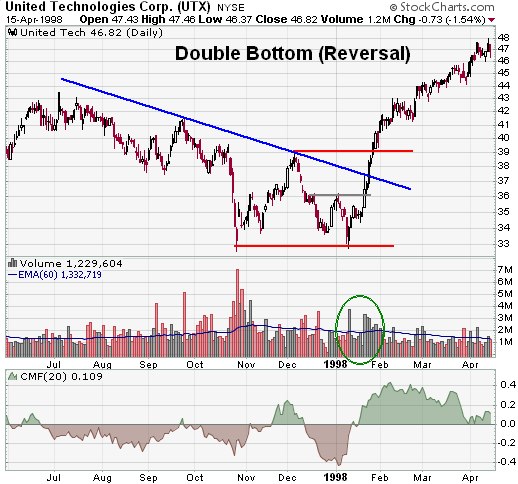
Source: Stock Charts
Michaël said he was expending the bitcoin price to perform a complete reversal and restest its bottom in May/June. Technically, it will be a double bottom scenario, which is a textbook bullish reversal pattern. In such a case, bitcoin would pullback to the upside to retest the previous peak, accompanied by high volume, and followed by a breakout to turn the said peak resistance into new support.
“Personally, I’d sign for this: 1) Slight upwards/sideways continuation of BTC till the end of April; 2) First altseason; 3) May/June BTC downwards to bottom; 4) July – September sideways & major 5) After September beginning of uptrend bull market BTC,” said Michaël. “But, that’s me.”